I come from an analytics background in the healthcare industry. In healthcare there is a term called ‘precision medicine’. Precision medicine is closely related to areas such as preventative medicine, which tracks how our diet and environment influence our health over the years, as well as genetics, where therapies are tailored to an individual’s specific genome.
Precision medicine is based on the fact that most medical care we receive today is based on heuristics and not personalized to a given individual. For example, in Geoffrey West’s book, “Scale”, he mentions one particular example where in his children’s medication, the dosing chart was based on a linear scale (double the weight = double the dosage) when it should be a log scale¹. The oversimplification and standardization of medical treatment has left gaps in possible opportunities to improve the well-being of our population at large. Precision analytics uses the same concepts as precision medicine and just like precision medicine addresses gaps in healthcare, precision analytics addresses gaps in data reporting. One example is the imprecision of standardized data metrics.
Standardized Metrics
Standardization is a great place to start when trying to improve a process using data — to use another healthcare example, just think how doctor’s simply washing their hands led to a huge reduction in deaths due to infectious disease². The role of standardized metrics can’t be understated. Without them, we would not have a common language to discuss things ranging from GDP and unemployment to the accounting formula (assets = liabilities + equity anyone?). However, even these well known standardized metrics have many variants. The variants in metrics underscores the value of customized metrics as well and also establishes a fundamental truth: data can be changed and combined in numerous ways.
In businesses today, this ability to combine, filter, and ‘munge’ the data can at times be seen as a negative aspect of working with data. Have you ever worked at a company where, when two numbers don’t match, the organization doubles down on the definition of the one they are most comfortable with? Or been handed down metrics that were established at the company level, but unsure how to improve them from your small department? Both of these situations could benefit from more specific and personalized metrics.
Personalized Metrics
Personalized metrics are already on the rise with our increased ability to gather data. For example, in “Data Governance: The Definitive Guide”, the authors explain how in the NFL, their traditional standardized metrics were no longer sufficient to answer more nuanced questions³. The authors said,
“Traditional metrics such as “yards per carry” or “total rushing yards” can be flawed; recognizing a need to grow its analytics and data collection process, the NFL created Next Gen Stats (NGS). NGS is a league program wherein the pads of every player and official, along with game balls, pylons, and first down chains are all tagged with a radio frequency identification (RFID) chip”
The increase in data led to an increased ability to answer personalized and specific questions. This new information could be combined in many more ways.
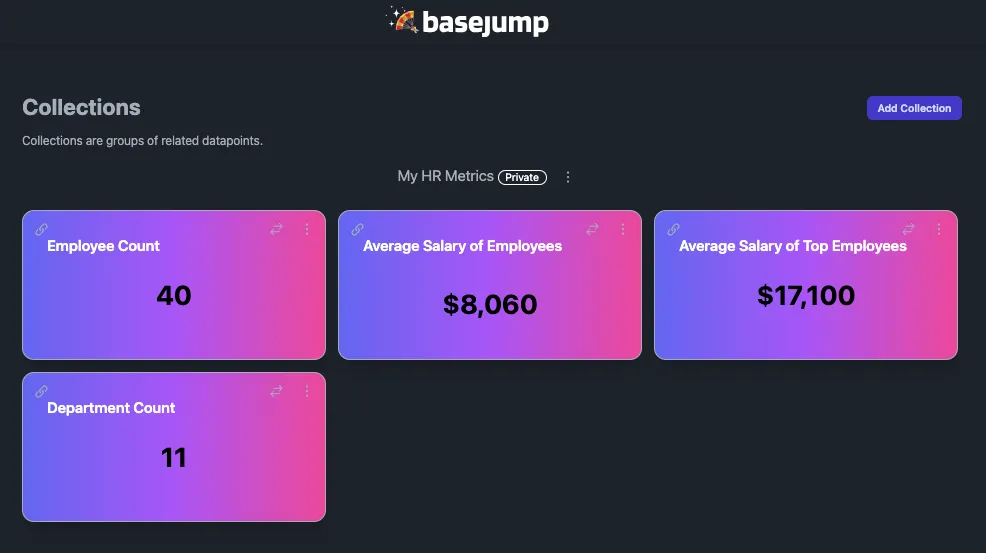
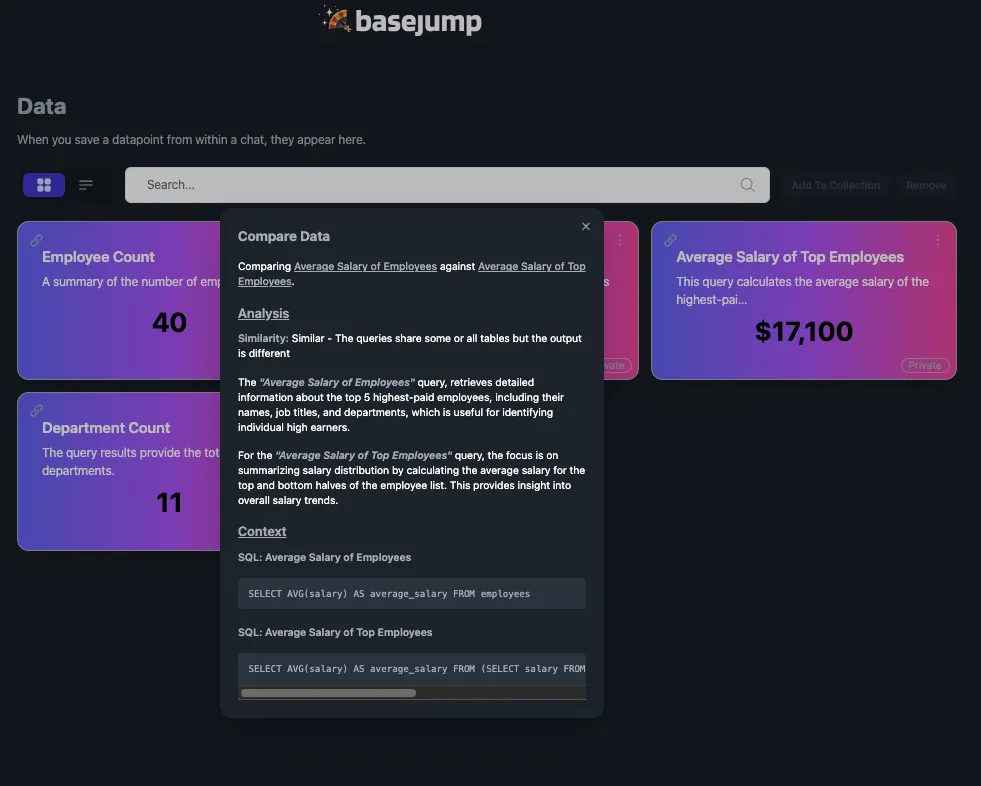
I imagine a future where differences between data sources will be able to quickly be explained and the fear over numbers not matching will decrease due to an increase in transparency. At Basejump AI⁴, the initial solution to inconsistent data is to allow anyone to be able to compare a report to another with a link. Our comparison is based on a combination of deterministic evaluation⁵ and using AI to explain differences. The deterministic evaluation is done first and assigns 1 of 4 labels:
- Identical: There are no differences
- Equivalent: The output and tables are the same, but queries are structured differently
- Similar: The queries share some or all tables but the output is different
- Different: The queries share no tables
AI is then used to explain the reason for this difference. This is a screenshot of what this looks like:
Conclusion
If every department is able to create customized and fully explainable metrics, the anxiety over only relying on a few metrics to drive business outcomes will diminish and the company will likely see better results.
If there’s one thing that AI is enabling almost more than anything else it is hyper-personalization. With generative AI, we will soon be able to have most anything created that is tailored specifically to us; whether that be a video game that is always changing based on what we input, a unique video that was made just based on a short summary of what you wanted, an essay based on a prompt, a piece of art…the list goes on and on. So why shouldn’t this same personalization apply to the data we use at work?
All of this being said, I can’t finish this article without saying that data governance has a big role to play. AI can be seen as another tool to help data governance with its mission of ensuring data is well managed and reducing barriers to communication. I’m excited to see how the next generation of tools enable personalized metrics and how Basejump AI specifically will help realize that vision!
One more thing! If you’re interested in using AI helping to find personalized metrics, visit our website Basejump AI to book a demo: https://basejump.ai/
References
- Geoffrey West (2017), Scale, p.54–55
- Poczai, P., & Karvalics (2022), The little-known history of cleanliness and the forgotten pioneers of handwashing, PubMed
- Eryurek et al., Data Governance: The Definitive Guide (2021), Chapter 1, O’Reilly
- Basejump AI
- Zeigerman, I. (2023), Automatically detecting breaking changes in SQL queries, Tobiko Data